
M. S. T. Carpendale, D. J. Cowperthwaite, M-A. D. Storey, F. D. Fracchia, A. Liestman
School of Computing Science, Simon Fraser University
Burnaby, British Columbia, Canada. V5A 1S6
carpenda@cs.sfu.ca
Introduction
As the primary metaphor for computer use shifts from an extension of the personal desktop to a gateway into a vast information space, representing this expanse of information on our relatively small screens becomes increasingly problematic. This discrepancy between display space and information space has been associated with problems in navigation, interpretation and recognition [4]. Our response, distortion based techniques, generally create a multi-scale view that makes chosen sections of the information display more readable by magnifying them while simultaneously adjusting the relative positioning of adjacent sections so as not to cause congestion and/or overlap (for surveys see [4, 6, 7]).
Considerable effort has been put into creating viewing methods appropriate for the information displayed. For each method, a view results from the combination of several different distortion components, creating visual displays that vary considerably. To allow for a fresh perspective on a this problem we identify the distinct aspects that comprise the distortion paradigm. Identifying these components and understanding their effects provides a basis for developing new techniques and for more readily tailoring existing techniques to a given type of data or information application.
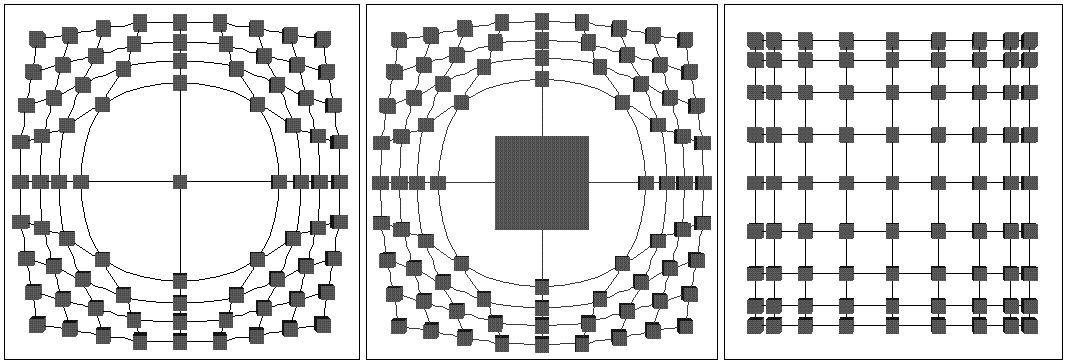
Figure 1. Left to right: orthogonal
magnification and displacement; orthogonal displacement only,
radial displacement only; step magnification; sections of uniform
displacement
Click on the picture for a larger image
Distinctions
Figure 2. Left three; distortion variations: Right two; local displacement expands node cluster.
Click on the picture for a larger image
References
[1] Carpendale, M. S. T., Cowperthwaite, D. J., and Fracchia, F. D., 3-Dimensional Pliable Surfaces: For effective presentation of visual information. ACM UIST, 1995 217-226.
[2] Carpendale, M. S. T., Cowperthwaite, D. J., Storey, M-A.D., and Fraccia, F. D., Exploring Distinct Aspects of the Distortion Viewing Paradigm. Technical Report TR 97-08, School of Computing Science, Simon Fraser University, March 1997.
[3] Henry, T., and Hudson, S., Interactive Graph Layout., ACM UISIT, 1991, 55-64.
[4] Leung, Y. K., and Apperley, M. D., A Review and Taxonomy of Distortion-Oriented Presentation Techniques. ACM ToCHI, 1(2), 1994, 126-160.
[5] Misue, K., Eades, P., Lai, W., and Sugiyama, K., Layout adjustment and the mental map. Technical report IIAS-RR-94-1E Fujitsu Laboratories, 1994.
[6] Noik, E. G., A Space of Presentation Emphasis Techniques for Visualizing Graphs. Graphics Interface, 1994, 225-233.
[7] Spence, R., A taxonomy of Graphical Presentation., Information Engineering Section report 93/3, Imperial College of Science, Technology and Medicine, 1993.
[8] Storey, M-A. D., and Müller, H. A., Graph layout adjustment strategies. Graphing Drawing, 1995, 487-499.