A Real-time 3D Visualization of Global MHD Simulation
for Space Weather Forecasting
Daisuke Matsuoka
Authors: Daisuke MATSUOKA 1, Ken T. MURATA 2, Eizen KIMURA 3, Hironori SHIMAZU 4,
Takashi TANAKA 5, Shigeru FUJITA 6, Shin-ichi WATARI 4, Yasuichi KITAMURA 4,
and Hideo MIYACHI 7
1 Graduate School of Science and Technology, Ehime University
2 Center for Information Technology, Ehime University
3 Graduate School of Medicine, Ehime University
4 National Institute of Information and Communications Technology
5 Graduate School of Sciences, Kyushu University
6 Meteorological College
7 KGT Inc.
Recently, many satellites for communication networks and scientific observation e.g., GPS (Global Positioning System), are launched in the vicinity of the Earth (geo-space). The electromagnetic environments around the spacecraft are always influenced by the solar wind flowing from the Sun and the induced electromagnetic (EM) fields. They occasionally cause various troubles or damages such as electrification and interference, to the spacecraft body. It is important to forecast the geo-space EM environment as well as the ground weather forecasting.
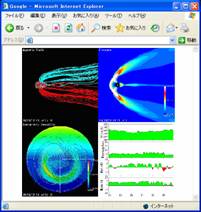
Meanwhile, owing to the recent remarkable progresses of computer technologies, numerical simulations have become powerful research methods in the solar-terrestrial physics. For the necessity of space weather forecasting, NICT (National Institute of Information and Communications Technology) has developed a real-time global MHD (MagnetoHydroDynamics) simulation system of interplanetary space-magnetosphere-ionosphere couplings, which has been performed on supercomputer SX-6. The real-time solar wind parameters from the ACE spacecraft at every one minute are adopted as boundary conditions for the simulation. Simulation results are saved in the HDF5 format data files and 2-D data plots are updated every 1 minute on the NICT webpage as shown in Fig.1.
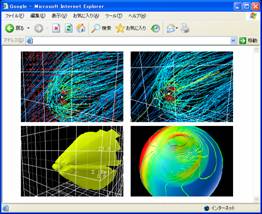
In the present study, we develop the present NICT web system and construct a real-time 3D visualization system of the global MHD simulations. The 3-D visualization of simulation results are updated every 20 minutes in the following four formats as shown in Fig.2: (1)Particle tracer along the velocity, (2)Streamlines of magnetic field lines, (3)Isosurface of temperature in the magnetosphere and (4)Isoline of conductivity and orthogonal plane of potential in the ionosphere. A 3-D viewer application working on IE browser is implemented by authors, which is based on the AVS/Express (Application Visualization System).
Fig.1 2-D plots of simulation results Fig.2 3-D visualization of simulation results